
 The evolution of a star can be shown on the HR diagram.
Key Concepts
This diagram (by R.N. Bailey) shows a summary of the stages in the evolution of a star's life that we have covered so far.

Note the importance of the mass of the star in determining:
- Whether a protostar commences fusion to join the main sequence or becomes a brown dwarf
- The stellar classification of the star during the main sequence
- Whether a supernova results in the formation of a neutron star or black hole
The changes between the main sequence, giant / super giant and white dwarf stages can be represented on the HR diagram.

Taking these in turn:
- Shows a star's entry to the main sequence, as its protostar rises in temperature and commences fusion.
- Shows a star's move from the main sequence to the giant stage, with a reduction in temperature due to the increase in radius and an increase in luminosity associated with helium fusion.
- Shows the end of the red giant stage with the shedding of the planetary nebula as the star expands for the last time.
- Shows the cooling of a white dwarf corresponding with its decline in luminosity due to the absence of fusion.
Use flashcards to practise your recall.
Use quizzes to practise application of theory.
START QUIZ!
Large stars may end their lives as black holes.
Which of the following is the approximate minimum mass of a main sequence star that could possibly form a black hole?
The core left over after a supernova explosion must be greater than \(4M_\text{sun}\). This means that the original star must have a considerably larger mass.
A protostar has a mass of \(4M_\text{sun}\). Where on the HR diagram below will it enter the main sequence?
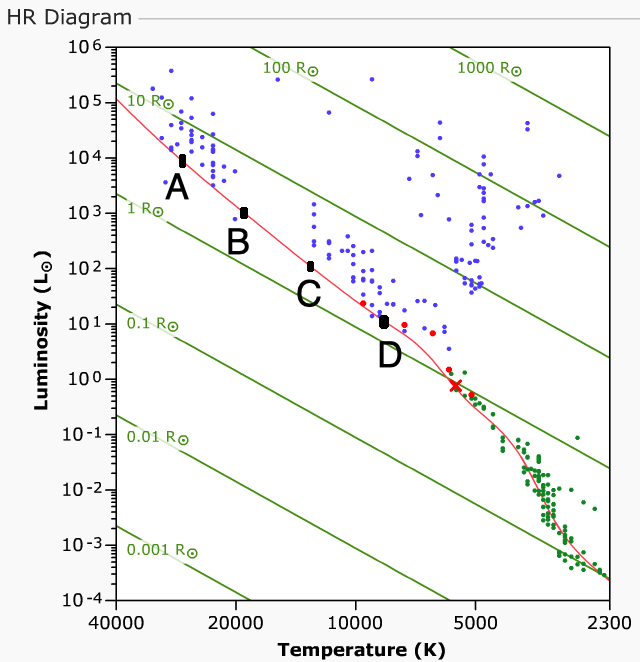
\(M \propto {\root 3.5\of{L} }\Rightarrow L\propto M^{3.5}\)
\(4^{3.5}=128 \approx 10^2\) on the luminosity axis (relative to the sun).
A white dwarf takes in mass from a red giant.
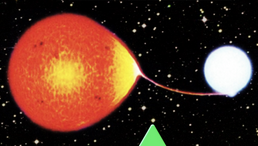
The white dwarf could become a...
If it exceeds \(1.4 M_\text{sun}\) it will explode forming a type Ia supernova.
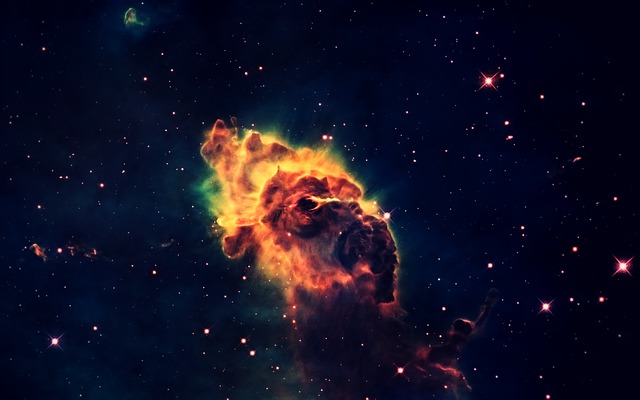
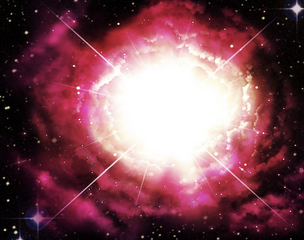
This image is an artist's impression of a supernova.
We don't observe many supernovae in the night sky because...
A supernova is an exploding star. They can be observed from Earth over just hours or days.
Which of the following elements does not exist in stars before the supernova stage?
Energy is not net released when smaller nuclei are fused to form uranium. Only a supernova explosion can provide the energy required to fuse elements heavier than iron.
 Twitter
  Facebook
  LinkedIn