The following table represents the key economic data for two nations on the same continent.
Country A $ Bn
Country B $ Bn
Private consumption
865
400
Government spending
410
195
Investment
160
96
Exports
320
235
Imports
400
175
Net property income from abroad
50
(105)
Questions
ai. Calculate the gross domestic product and gross national income for both nations, using the expenditure method. [2]
Country A - $1,355b and GNI = $1,405b
Country B - $841b and GNI = $736b
ii. Explain two possible reasons why country B might have a large negative value for net property income from abroad. [4]
One possible reason why country B might have a large negative value for net property income from abroad is that the nation is home to a large number of MNCs, whose output contributes significantly to country Bs GDP but then exports many of the profits back to their host nation, which are not counted in GNI figures.
A second reason might be that as a wealthy nation the country attracts a large number of migrants who work in the nation, again contributing to country B's GDP or national output. However, many send a sizeable proportion of their disposable income back to their own country to help family members.
iii. Identify two other methods of calculating national income other than the expenditure method. [2]
Table 2 development indicators for both nations:
Country A
Country B
Human development index (HDI)
0.71
0.97
Gini co-efficient
0.65
0.40
GNI per capita
$11,765
$49,540
Population
119,422,014
20,104,965
Freedom of doing business index
123/190
7/190
bi. Explain how the human development index is calculated? [2]
HDI is calculated by three indexes, economic, health and education, with a nation's HDI calculated by the sum of three indexes measuring GNI per capita, years of schooling and life expectancy.
ii. Explain why nations such as country B, with a high GNI and GDP per capita are also likely to enjoy a greater HDI ranking. [2]
One reason is that GNI per capita is one of the three measurements of HDI so a high GNI per capita will, of course, contribute to a higher HDI ranking. In addition a nation with a high level of GDP/GNI per capita is also likely to enjoy greater health benefits; through better diet and access to healthcare as well as more educational opportunities.
ii. Using table 1 and 2 compare the living standards of the two nations. [4]
Both tables indicate that citizens of country B enjoy a much higher standard of living, shown by significantly higher levels of wealth and human development. While neither figure is definitive,for example national income measures only absolute differences and does not consider the cost of living in a country, the large disparity between GNI per capita and HDI suggests strongly that those citizens enjoy a better overall standard of living. Lastly, country B also enjoys significantly lower levels of income inequality, as shown by the gini-index of each nation.
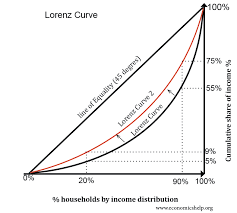
iii. Using the information contained in table two explain, using a suitable diagram, the level of income inequality in the two nations. [4]
As the diagram illustrates income inequality in country B is significantly lower than in country A (0.4 on the gini index compared to 0.65 for country A), shown by a curve further to the left of the Lorenz curve representing country 2.
c. Using information from the text and your knowledge of economics recommend a policy that nation A could employ to improve living standards fo its citizens. [10]
Living standards can be measured by economic growth, which represents a rise in real GDP or real national income; or improvements in HDI which is calculated by the sum of three indexes measuring GNI per capita, years of schooling and life expectancy. [Key terms]. The policy that I am recommending for to enable an improvement in living standards is the use of market based supply-side policies to grow the economy. [Policy stated].
Supply side policies are growth policies aimed at increasing aggregate supply (AS), a shift from left to right. They enhance the productive capacities of an economy while improving the quality and quantity of the four factors of production. [Key terms].
Economic growth resulting from supply side policies are illustrated in diagram one and shows a rise in real GDP from Y1 to Y2 brought about by a rise in the long run aggregate supply curve from LRAS to LRAS2. [Diagram explained].
Policies such as reducing red tape, less bureaucracy and deregulation might lead to more incentives to set up formal businesses, which may lead to economic growth and economic development (more jobs) and more (foreign) investment. [Application]. While this policy can also be applied in a developed country and has proven to be successful, many developing nations suffer disproportionately from overly burdensome regulations affecting new businesses start ups. [Analysis]. For example, in country B the nation is ranked only 123 in the ease of doing business rankings. [Table 2].
Another example of a market based policy might be deregulation of product markets and may be implemented to bring down barriers to entry, encourage new and dynamic market entrants. [Policy identified]. The effect of this policy might be to make markets more competitive and increase efficiency. Promoting competition is also called competition policy and promoting more competition stimulates a faster pace of invention and innovation to improve competitiveness. [Analysis].
A second policy might include privatisation of state industries, which contribute to the spread of an enterprise culture. As long as privatisation is accompanied by measures to promote competition, there are likely to be efficiency gains for the firm and productivity gains for the employees. Promoting more competition might stimulate a faster pace of invention and innovation to improve competitiveness. [Second example of suitable market based policy identified].
Tax cuts and tax incentives are also examples of market based supply-side policies that might lead to economic growth and development (through more jobs) and increased investment, breaking one of the poverty cycles that can affect LEDCs. [Third example of suitable market based policy identified]. As the poverty cycle above illustrates, one of the cycles of poverty includes low levels of investment and production, leading to low wages and a lack of capital e.t.c. By opening up markets to new businesses this cycle can begin to be broken by steady growth in the number of businesses established. This creates greater competition, more products to consume and improvements in productivity. [Evaluation].
On the other hand, there are concerns (weaknesses of) market-oriented policies and their impact on developing nations. [Counter arguments introduced].
For example, one of the central pillars of market based supply-side policies is the gradual fading and elimination of government price distortions, allowing markets to operate at their most optimum. [First weakness established]. While such policies are likely to be effective in the long-run there is almost an inevitable short-term social consequence. For example, reducing subsidies for basic necessities (food and fuel e.t.c) are likely to lead to higher prices of essential products and an increase absolute poverty rates. Greater inequality and rises in poverty are also likely to be unwanted side-effects, at least in the short-term as government support systems are reduced. Table 2 highlights that the country already has high levels of income inequality, with a gini index og 0.65. [Evaluation]. This was evidenced within developing nations such as Sri Lanka, Turkey and a number of South American nations that were forced to adopt such policies, called structural adjustment policies, as conditions for accessing loans from the World Bank. [Real-world example].
In conclusion, therefore, it can be established that market-based supply-side policies do have weaknesses or limitations to their effectiveness. They may even cause greater inequality and poverty in the short-term but have proven to be effective in encouraging economic development within LEDCs that have adopted them on a sustained basis. [Summary conclusion].
Feedback
Which of the following best describes your feedback?

 As the diagram illustrates income inequality in country B is significantly lower than in country A (0.4 on the gini index compared to 0.65 for country A), shown by a curve further to the left of the Lorenz curve representing country 2.
 .jpg) Supply side policies are growth policies aimed at increasing aggregate supply (AS), a shift from left to right. They enhance the productive capacities of an economy while improving the quality and quantity of the four factors of production.
Supply side policies are growth policies aimed at increasing aggregate supply (AS), a shift from left to right. They enhance the productive capacities of an economy while improving the quality and quantity of the four factors of production.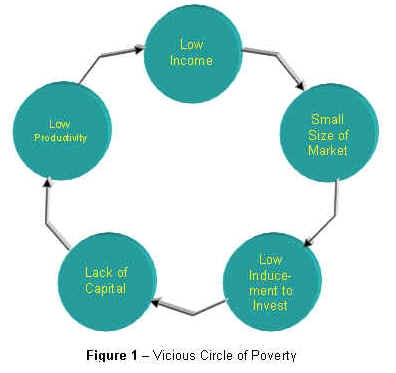 and productivity gains for the employees. Promoting more competition might stimulate a faster pace of invention and innovation to improve competitiveness.
 Twitter
  Facebook
  LinkedIn