

This page covers the nature of perfect competition, price and output in the market, profits and losses and efficiency in perfect competition.
Assumptions of perfect competition
- There are a large number of small buyers and sellers so no one buyer or seller can influence market price or output.
- Firms in the market sell a homogenous product which means there are no differences between the goods and services supplied by different firms.
- There is perfect knowledge on the part of buyers and sellers so that all agents in the market know about the prices being charged by all the producers in the market.
- There are no barriers to entry or exit in the market. This means the costs of setting up in the market are not higher than the normal costs of setting up in a market.
Examples of perfect competition
Agricultural markets provide the best examples of perfect competition.
The example used in this chapter is rice farmers in Vietnam where there are 1.3 million producers.
Market demand and supply determine the market price and output.
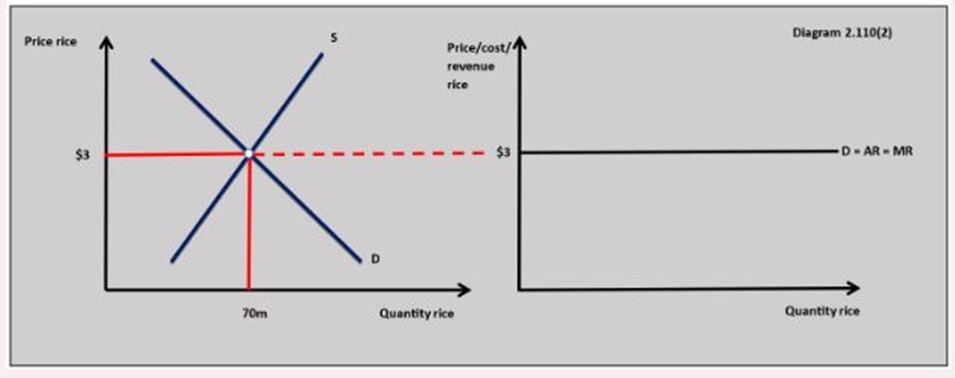
Diagram 2.110(2) shows how the market demand and supply for rice determine the price and output in the market.
The demand curve facing the firm
The market price is the price each firm in the perfect market has to charge or take.
If the firm tries to charge more than the market price then the quantity demanded will fall to zero because consumers can buy exactly the same product from an alternative supplier at the market price.
There is no incentive for firms to charge less than the market price because they can sell all they want at the market price.
The assumptions of the model mean that firms are price takers and face a perfectly elastic demand curve. This is shown in diagram 2.110(2)

Revenue is the income a firm receives from selling its goods or services. There are three ways of expressing the revenue a business receives:
Total revenue
Total revenue (TR) is the total income a business receives and is calculated as:
- price x quantity = total revenue
- P x Q = TR
Average revenue
Average revenue (AR) is the revenue per unit of output sold by a firm and is calculated as:
- total revenue / output = average revenue
- TR / Q = AR
- AR = P
Marginal revenue
Marginal revenue is the change in total revenue when one more unit of output is sold and is calculated as:
- change in total revenue / change in output = marginal revenue
- ∆TR / ∆Q = MR
With the perfectly elastic demand curve, the firm faces in perfect competition the price the firm receives is equal to average revenue and marginal revenue.
The demand curve the firm faces can be expressed as: D = AR = MR
In the rice market example in diagram 2.110(2), each farm has to charge $3.00 per kilo which equals the average revenue and marginal revenue for each firm in the market.
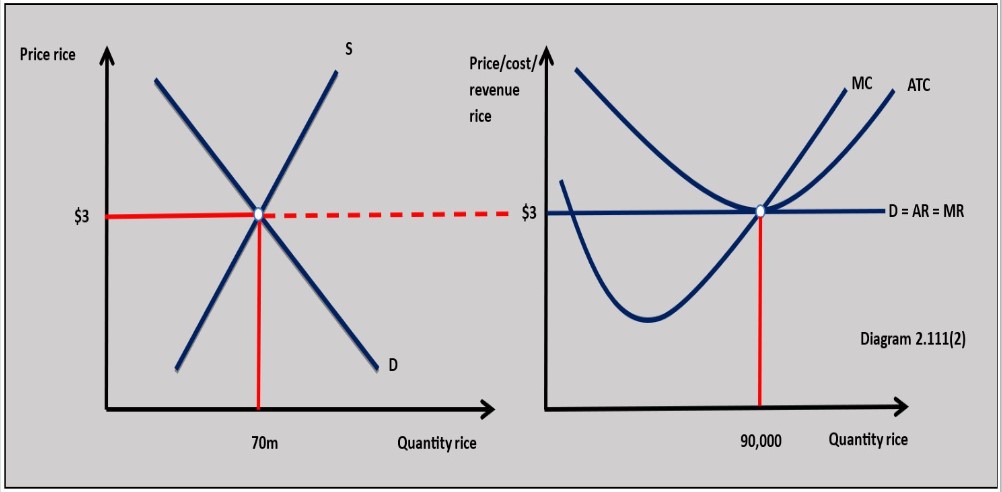
Firms in the industry aim to profit maximise which means they produce where marginal cost equals marginal revenue when marginal cost is rising.
In diagram 2.111(2), the firm produces 90,000 kgs of rice to maximise profit.
Adding together the total output of each producer in the market gives a total market output of 70 million.

Normal Profit
Normal profit is the minimum profit firms need to earn to remain in a particular market. It represents the resource cost of enterprise as a factor of production.
Entrepreneurs who enter a market will need a certain level of profit to reward them for the risk of setting up production in the market. This means normal profit is included as part of the firm's total cost of production.
Normal profit is achieved when total cost is equal to total revenue or average total cost equals average revenue:
ATC = AR
Diagram 2..111(2) shows firms in the perfect market for rice where each producer is earning normal profit.
Abnormal profits
Abnormal profit is earned by a firm when the entrepreneur earns more than the minimum profit required to keep the firm in the industry.
This means total revenue is greater than total cost: (AR > ATC) x Q.
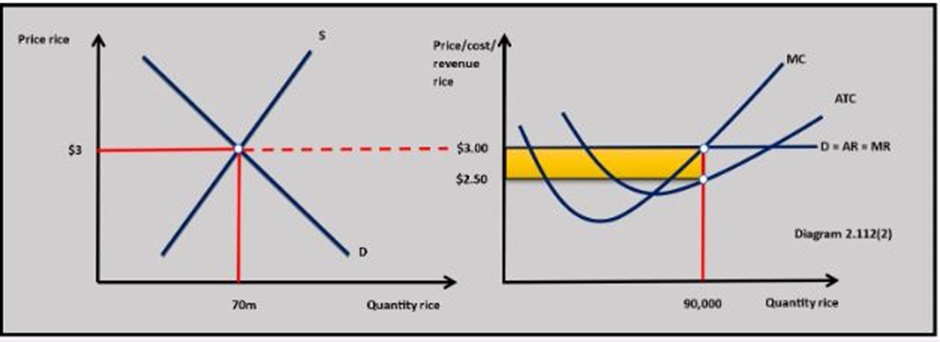
In diagram 2.112(2) AR > ATC because ATC has fallen in the rice market.
This can be calculated as: $3.00 - $2.50 = $0.50 per unit
$0.50 x 90,000 = $45,000 total abnormal profit.
New firms see this as an opportunity to make abnormal profits and enter the orange market.
This leads to an increase in market supply which causes the market price to fall reducing the abnormal profit of the existing producers until firms stop entering the market and profits return to normal.
Losses
Losses occur when total cost is greater than total revenue which can be expressed as:
(ATC > AR) X Q.
This means firms are making less than normal profit so entrepreneurs will start to leave the industry because they are not making enough profit to keep them in the market.
Diagram 2.113(2) losses in the market price for rice when the price falls from $3.00 to $2.00.
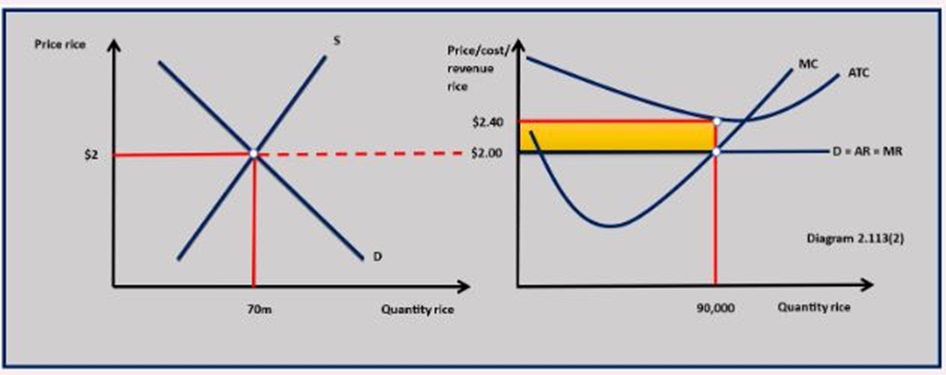
In diagram 2.113(2) this can be calculated as:
$2.00 - $2.60 = -$0.40 per unit
-$0.40 x 45,000 = -$18,000
As firms leave the industry market supply falls, price rises and the profit for the remaining firms in the industry will return to normal.
Productive (technical) efficiency
Productive efficiency is achieved when all firms in the industry are producing where they achieve the highest output per unit of resource input.
This means each firm in the market is producing at the profit maximising output at the minimum point of average total cost: MC = minimum ATC
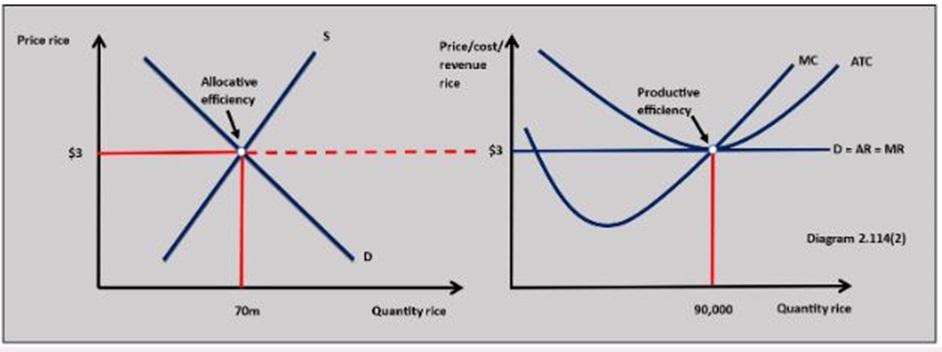
This is achieved in perfect competition when firms are making normal profits, but not abnormal profits or losses. This is shown in diagram 2.114(2) at an output of 90,000 units.

Allocative efficiency
Allocative efficiency is achieved when resources are allocated in a market to maximise the social/community surplus.
This occurs when market demand equals market supply.
Allocative efficiency is shown in diagram 2.111(2).
This is achieved in all profit-making situations in perfect competition.
Evaluation of perfect competition
No markets fully achieve the strict conditions of perfect competition. There will always be some differences in the goods sold by different producers and some barriers to entry are likely to exist in every market for some producers.
Only a small number of industries in an economy come close to being perfectly competitive. Many markets in the economy exist with conditions that are completely different to perfect competition.
Perfect competition might achieve the allocative and productive efficient output in the long run, but the goods and services sold in the market offer no real choice to consumers because of the assumption of homogenous products.
The model makes no allowance for positive or negative externalities which will affect welfare in society.
Explain the impact an increase in demand would have on the market price and output of an agricultural product in the short run and long run, assuming the market is perfectly competitive. [10]


 Twitter
  Facebook
  LinkedIn