(a) Explain why costs in both the short-run and long-run are U shaped? [10 marks]
Command term: Explain
How to write this part (a) response:
Introduction
Define the economics terms used in the first part of the essay - short run, long run.
Main Body
Using an appropriate diagram illustrate the short run and long run cost curves
Using accurate specialised terminology explain the difference between cost curves in the short and long run
Conclusion
Concise summary, consistent with the main body (do not add any new information in the conclusion)
Click on the arrow to view my exemplar response
The short-run in economics is not a fixed time period but instead the time period when at least one of the costs of production is fixed, while in the long-run all costs are variable. [Key term]. For example an entrepreneur takes out a one year lease on an office. This is the firm’s fixed cost while all other costs in the business are variable and so in this example the short run would be one year, until the lease on the office expires. [Application].
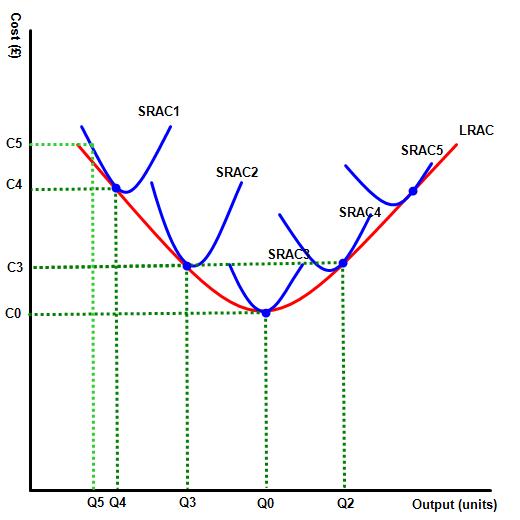
The diagram to the right illustrates a U shaped SRAC diagram and LRAC diagram with the LRAC curve representing a locus of points made up of SRACs. [Application of diagram].
While the two curves are U shaped and look similar, the SRAC is U shaped due to the law of diminishing returns while the shape of the LRAC can be explained by economies / diseconomies of scale. [Application].
In other words, in the short run, as a firm increases its output level, there is an initial fall in average costs due to increased specialisation. However, as more variable units are added to a fixed unit, average costs start to rise due to the law of diminishing returns. [Analysis].
The LRAS curve is therefore made up of a locus of points derived from the optimum point on each of the SRAS curves. The LRAC initially starts to fall due to economies of scale but then rises due to diseconomies of scale. [Analysis].For example, economies of scale include bulk buying or specialist automated machinery that might reduce production costs, while diseconomies of scale include higher production costs resulting from poor communication. [Summary conclusion].
Key terms used: costs, short run, long run, economies and diseconomies of scale, diminishing returns
(b) Using real-world examples, evaluate the view that firms in monopoly will charge higher prices and lower output levels than firms in perfectly competitive markets? [15 marks] -HL only
How to write this part (b) response:
Introduction
Define the economics terms not used in the first part of the essay - perfect competition amd monopoly.
Main Body
Using accurate specialised terminology and a suitable diagram illustrate the market for a product in perfect competition and monopoly, illustrating the equilibrium level of output and market price in both market structures
Using accurate specialised terminology and an appropriate diagram explain how the equilibrium level of output is higher in perfect competition and market price lower than in markets dominated by one producer
Using accurate specialised terminology and an appropriate diagram explain how monopolies may be able to benefit from economies of scale, leading to higher output and lower prices for consumers, in some circumstances?
Demonstrate a balanced approach both in support of and the arguments against the view that perfect competition will offer greater benefits to consumers than firms in monopoly
Use real life examples, ideally from your own country, fixed to the command term.
Conclusion
Concise summary, consistent with the main body (do not add any new information in the conclusion)
Click on the arrow to view my exemplar response
Command term: Evaluate
Perfect competition is a market structure with many firms producing homogenous goods or services and many buyers. Firms in the market are price takers and the industry is highly competitive. [Key term]. Monopoly business, by contrast, have just one business in the market place. Monopolies are price takers and there is limited competition within the market. [Key term].
The impact of the two markets on equilibrium output and price are shown on the diagram. As the diagram shows in many circumstances the competitive market environment offers higher output levels (Qpc compared to Ppc) and lower prices (Ppc rather than Pm) than a monopoly firm. This is because monopolies are price makers, meaning that they can reduce supply in order to force up equilibrium price to Pm. By contrast competitive firms are price takers and have no control over market supply or price and produce at the equilibrium level of Qpc. On diagram 1 for example, the perfectly competitive firm will produce where AR = MC (allocative efficiency), where as the monopolist will be able to effectively reduce supply to the point where MC=MR. [Explanation of diagram supporting the statement in the question].
Perfect competition is both allocatively efficient, because price equals marginal cost, and productive efficient, because firms produce at the lowest point on the average cost curve. It is also allocatively efficient because competition between firms will act as an incentive to increase efficiency. firms in perfect competition will always be allocatively and productively efficient, in the LR, where as monopolies are not. [Analysis].
Of course, it is not always the case that all goods and services are produced more cheaply in competitive markets than monopoly, nor that firms in perfect competition will always provide greater benefits to consumers than firms in monopoly. For example, a firm in monopoly may be able to operate at a higher output level and offer lower prices than competitive firms, if the firm is operating in a market that offers sufficient economies of scale from mass production. [Evaluation].
Economies of scale describes a situation when a firm experiences increasing returns to scale, including processes which enable a firm to reduce its long run average costs as output rises. In situations where monopolies enjoy the economies of scale they maybe able to operate at lower costs and prices. This would apply in situations where the scope for economies of scale was considerable. This is shown in the next diagram where the price / output levels in the competitive firm are represented by Ppc and Qpc where as in monopoly, due to the benefits gained from economies of scale, market equilibrium is represented by price (Pm) and output at Qm. [Explanation of diagram presenting the counter argument in the question].
A recognition that while firms in monopoly may benefit from economies of scale, firms operating in perfect competition will not enjoy those benefits. This means that in the above example, the monopolist is able to enjoy economic profits but still offer the consumer lower prices (Pm compared to Ppc) and greater choice (Qm compared to Pm), than firms in perfect competition. [Analysis].
A further argument in support of monopolies, in certain industries is the recognition that abnormal profits in monopoly may also provide funds for research and development as well as specialist machinery which may allow a firm operating as a monopoly to reduce prices further while still enjoying abnormal profits. Firms in perfect competition would be unable to do so. This makes monopolies particularly suitable for fields such as technology, aviation or telecommunications. Such industries are sometimes called natural monopolies, where a monopoly would normally offer greater benefits to the consumer than competitive firms. [Evaluation].
In conclusion, therefore, perfectly competitive firms will normally offer consumers lower prices and higher output UNLESS the economies of scale enjoyed by the monopolist are significant enough to allow the firm to enjoy abnormal profits and still provide lower prices to the consumer. [Summary conclusion].
Key terms used: perfect competition, monopoly, productive and allocative efficiency, economies of scale, natural monopoly
Feedback
Which of the following best describes your feedback?

 The diagram to the right illustrates a U shaped SRAC diagram and LRAC diagram with the LRAC curve representing a locus of points made up of SRACs.
 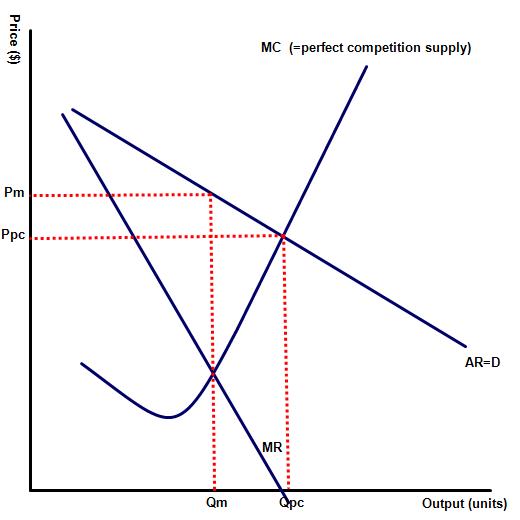 The impact of the two markets on equilibrium output and price are shown on the diagram. As the diagram shows in many circumstances the competitive market environment offers higher output levels (Qpc compared to Ppc) and lower prices (Ppc rather than Pm) than a monopoly firm.
 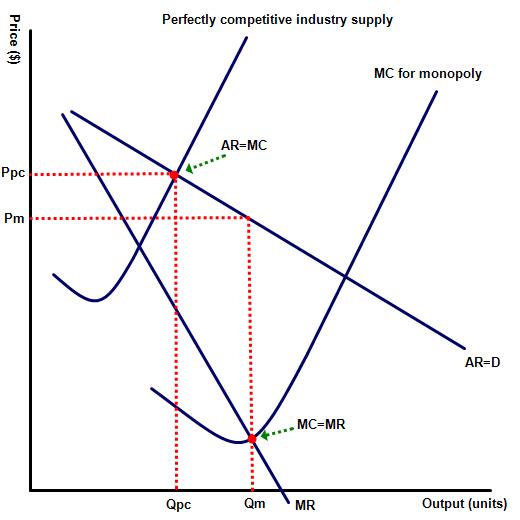 economies of scale they maybe able to operate at lower costs and prices. This would apply in situations where the scope for economies of scale was considerable. This is shown in the next diagram where the price / output levels in the competitive firm are represented by Ppc and Qpc where as in monopoly, due to the benefits gained from economies of scale, market equilibrium is represented by price (Pm) and output at Qm.
  Twitter
  Facebook
  LinkedIn