
This page covers the subsidy section of the syllabus. It includes the nature of subsidies, reasons for subsidies, how subsidies affect markets, the impact of PED and PES on subsidies and the way subsidies affect different stakeholders.
Definition
A subsidy is the amount of money the government pays producers to encourage the consumption and production of a good or service.
Examples of subsidies include those made to farmers to produce food, energy firms to produce renewable energy, and pharmaceutical businesses to produce new healthcare drugs.
Reasons for subsidies
Some goods and services carry significant social benefits to society and their consumption increases welfare in society.
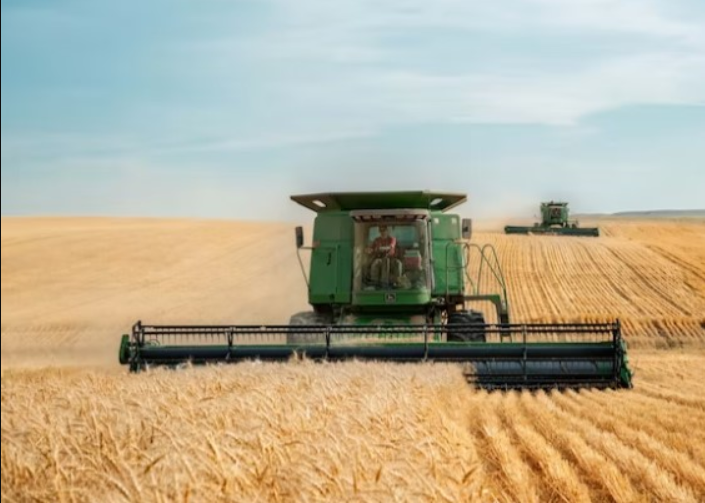
Governments sometimes use subsidies to support producers in key industries such as agriculture, steel and energy.
Subsidies can be used to support industries because they are important for economic development and employment.
Subsidies are sometimes paid to domestic firms to protect them from foreign competition.
A subsidy paid to producers reduces the costs of producing a good.
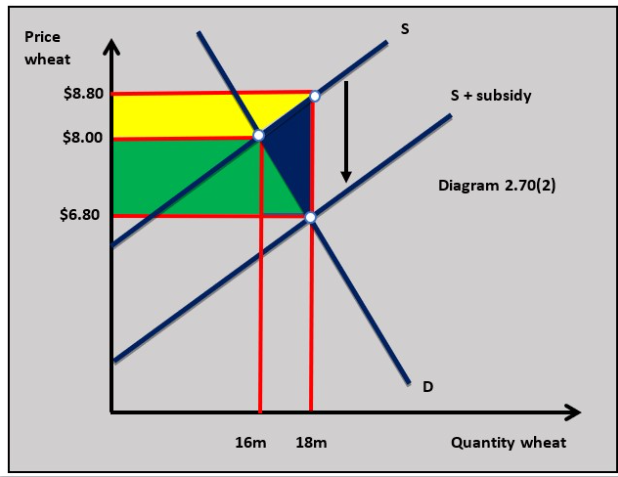
When a good is subsidised the supply curve shifts vertically downwards by the value of the subsidy paid to producers in the market.
For example, if the government decides to subsidise wheat by $2 per unit (bushel), then the cost of producing each unit will be $2 per unit lower.
This is shown in diagram 2.70(2).
The effects of a subsidy of $2 per litre on the wheat market would be:
- The value of the subsidy paid by the government is calculated as $2 x 18m units = $36m.
- As the market price of wheat falls by $1.20 the consumer benefits from the lower price and an increase in consumer surplus. The green area in diagram 2.70(2) shows the increase in consumer surplus and this can be calculated as: ($1.20 x 16m) + ($1.20 x 2m / 2) = $20.4m.
- The producer also benefits from subsidies because they receive an extra $1.20 per unit for the wheat they sell. The gain in producer surplus is shown by the yellow shaded area in diagram 2.70(2) and this is calculated as: ($0.80 x 16m) + ($0.80 x 2m / 2) = $13.6m
- When subsidies are applied there is a welfare loss because resources are drawn into the market by the subsidy that are not efficient enough to exist under normal market conditions. This is shown by the blue shared area in diagram 2.50(2) and can be calculated as: $2 x 2m / 2 = $2m
PED and PES will affect the size of the subsidy paid by the government as well as the subsidy benefits paid to the consumer and the producer.
The PED and PES will also affect the size of the welfare loss of the subsidy.
Price elasticity of demand
Inelastic demand means the gain in consumer surplus is great than the gain in producer surplus.
With price elastic demand the gain in producer surplus is greater than the gain in consumer surplus.
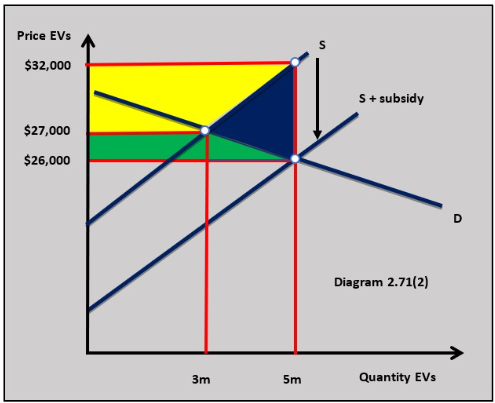 In diagram 2.71(2) a $5,000 subsidy is put on electric cars which have relatively elastic demand. The yellow shaded area is the gain in producer surplus and the green shaded area is the gain in consumer surplus.
Price elasticity of supply
If the PES of a good is more elastic than PED as in diagram 2.70(2) then consumers gain more surplus than producers.
If PES is less elastic than PED as in diagram 2.71(2) then producers gain more surplus than consumers.
Consumers
Subsidies lead to a fall in prices in a market, and this benefits consumers because they experience a rise in consumer surplus.
If the good is bought widely by low-income households then the benefit to those consumers is likely to be significant.
Producers
The gain in producer revenue and surplus that comes from a subsidy will help producers.
The greatest benefit will be when subsidies are targeted at producers who may not be able to survive without a subsidy.
Government
A subsidy needs to be paid for by the government which means there will be an opportunity cost of money that has been sacrificed from other areas of government expenditure.
A government might have to raise taxes to pay for the subsidy.
There will be a cost to the government in terms of managing and distributing a subsidy.
Welfare
The blue-shaded triangles in diagrams 2.70(2) and 2.71(2) show the welfare loss associated with the application of subsidies in markets.
A welfare loss occurs when there is an inefficient use of resources in a market.
Producers and resources are drawn into markets that would not be there without the subsidy and the cost of those less efficient producers represent a welfare loss.
Subsidies increase welfare if the consumption and production of the goods subsidised bring significant external benefits to society.
Explain the impact a subsidy on an agricultural good would have on the different stakeholders in the market. [10]

 Twitter
  Facebook
  LinkedIn