

This page focuses on income elasticity of demand. It covers its definition and measurement, the interpretation of the YED value, the Engels Curve and the application of YED to industrial change and business strategy.
Definition of YED
Income elasticity of demand is the responsiveness of quantity demanded to a change in household income.
Yed It is measured by the equation: % change in Qd / % change income = YED
Example of YED
For example, an 8% increase in household income leads to a 12% increase in the quantity demanded for restaurant meals would have a YED of 12% QD / +8% Y = +1.5
This means that for every 1% change in household income, the quantity demanded of restaurant meals will change by 1.5%.
Normal goods
Normal goods have a positive YED. Quantity demanded rises (falls) as income rises (falls).
Necessity goods
Necessity goods are normal goods that have a YED between 0 and 1.
This means a change in income will lead to a greater than proportionate change in quantity demanded.
The demand for necessity goods such as basic food, energy and public transport will have YED values between 0 and 1.
Luxury goods
Luxury goods are normal goods and the demand for them has a YED of greater than 1.
This means a change in income will lead to a greater than proportionate change in quantity demanded.
Luxury goods such as prestige cars, designer clothing and exclusive restaurants will have YED values of greater than 1.
Inferior goods
The demand for inferior goods will have a negative YED because the quantity demanded for inferior goods falls as household incomes rise and rise as incomes fall.
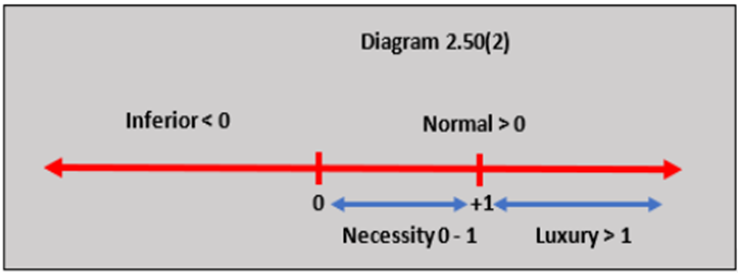
Diagram 2.50 shows the classifications of the YEDs of different types of good.
For example, the quantity demanded of tinned vegetables falls by 4% following a 5% rise in household income. This is calculated as: -4% QD / +5% Y = -0.80
Inferior goods such as tinned food, bus travel and synthetic clothing will often have negative YEDs.
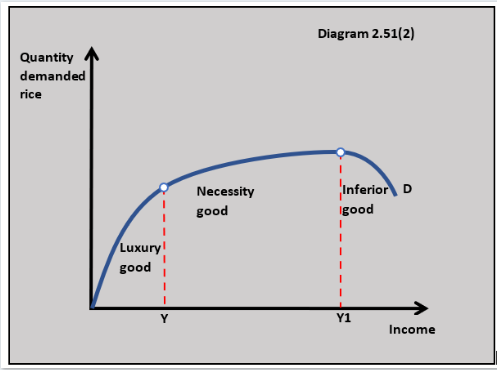
The nineteenth-century German economist Ernst Engel studied how the demand for different goods and services changed with income over time.
The Engel Curv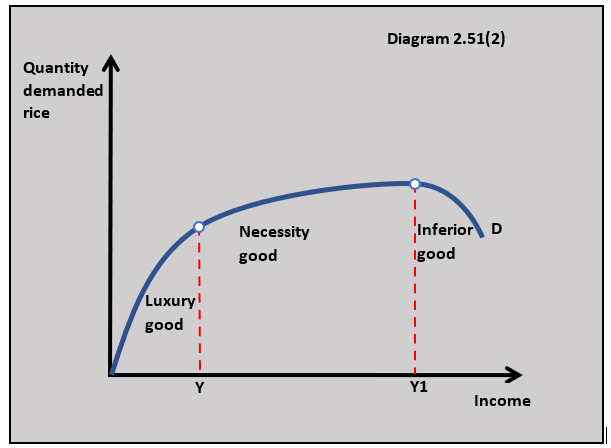 e relationship between income and demand is shown in diagram 2.51(2).
This Engel curve diagram shows how the demand for rice changes as income increases from being a luxury for low-income households to being a necessity good for medium-income households and then becoming inferior good for high-income households.
Structural changes in the economy
YED data can be used to show how industrial structure changes in the economy over time, as household incomes rise when the economy grows.
The YED for primary goods or commodities tends to have a YED of between 0 and 1. This means the demand for commodities tends not to grow as fast as incomes rise in the economy over time.
ELDC countries that specialise in primary commodities experience slow growth as world incomes rise.
Ma nufactured goods such as cars and computers have greater positive YED values. When incomes increase over time, manufacturing industries may experience significant growth.
Policymakers often see the development of manufacturing in developing countries as an effective way to deliver economic growth as world incomes rise.
The service sector of an economy, such as tourism and leisure, tends to have the highest positive YED values.
YED can be used to explain why the service sector increasingly dominates the industrial structure of many economies as household incomes rise.
Business strategy
The decline of Launderettes(inferior good) as
incomes rise.
Businesses respond to income changes by adapting what they sell.
As incomes have generally increased over time in most economies, many firms have responded by improving the quality of the products they sell because the demand for these goods has a positive YED value.
In economic recessions, businesses can market necessity/inferior goods as consumers switch to lower-priced inferior goods.
Explain how an understanding of income elasticity of demand can explain the growth in the service sector of an economy. [10]

Learn your definitions flashcards
 Twitter
  Facebook
  LinkedIn