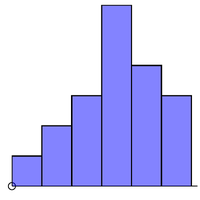
This page deals with one-variable statistics. You need to know how to represent the data in tables and diagrams (histograms, cumulative frequency graphs and box and whisker diagrams), as well measure the data using measures of central tendency...
To access the contents of this site, you need to log in or subscribe
Feedback
Which of the following best describes your feedback?

 Twitter
  Facebook
  LinkedIn