
 In this topic, we will look at
- Different forms of data presentations and graphs
- Statistical measures
- Linear Correlation
- Probability and Compound Events
- Conditional Probability
- Discrete Random Variables
- Binomial Distribution
- Normal Distribution
- Continuous Random Variables
- Poisson Distribution
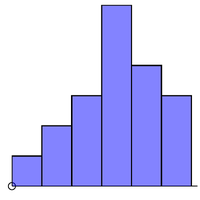
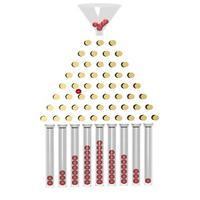
Representing and Measuring Data
This page deals with one-variable statistics. You need to know how to represent the data in tables and diagrams (histograms, cumulative frequency graphs and box and whisker diagrams), as well measure the data using measures of central tendency...
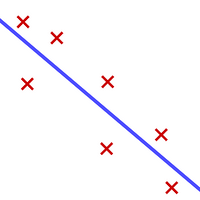
Linear Correlation
This page is all about looking for correlations in bivariate data (to see if there is a relationship between x and y variables). You will learn how to calculate r, Pearson’s product-moment correlation coefficient and how to interpret it....

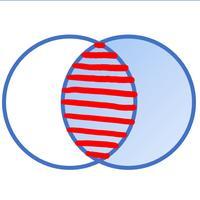
Probability Calculations
This page is aimed to help you with all the basics of probability. You will learn how to list outcomes, how to use Venn diagrams and probability trees. you will also find out about mutually exclusive events and independent events and get plenty of practice
Conditional Probability
You may well have tried the Monty Hall problem, a question based on the game show 'Let's Make a Deal'. In the game show, extra information is given about the whereabouts of a prize. If you use this extra information, you are more likely to choose the corre
Discrete Random Variables
On this page we will explore the concept of discrete random variables and their probability distributions. We will look at how we can display probability distributions in tables or as functions. The questions are not so complicated (it is just a way of for
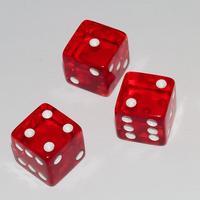
Binomial Distribution
The Binomial distribution is an example of a discrete random variable. It has two parameters n (number of trials) and p (probability of success of one trial): X~B(n , p). For a situation to be described using a binomial model, the following must be true
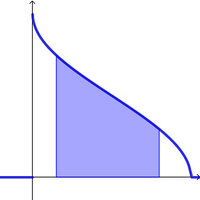
Continuous Random Variables
A random variable is continuous if the values can be expressed as an interval. Calculations are for continuous variables, for example heights or times, that is, something that can be measured rather than counted. In order to calculate probabilities,...
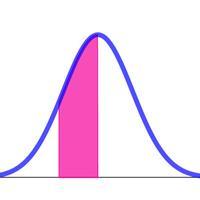
Normal Distribution
The normal distribution is an extremely useful statistical distribution. Data for heights and weights of adults and objects produced by machines, for example, tend to follow the normal (bell-shaped) distribution. More importantly, if we take large enough s
 Twitter
  Facebook
  LinkedIn